Time Diagram
![[UNIX GRAPH SMALL]](../gif/unixsm.gif)
Select
Description
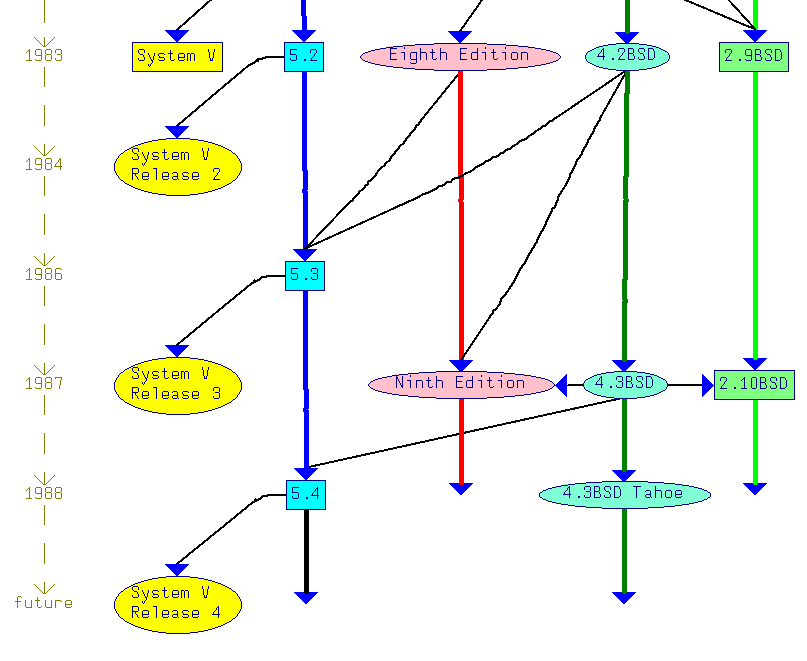
This is a time graph and shows the dependences in the history
of different Unix versions.
This example is recreated according to a picture in
A. Silberschatz, J. Peterson, P. Galvin:
Operating System Concepts, Fig. 15.1, Addison Wesley 1991
.
The very first original of this picture was in
Leffler/McKusick/Karels/Quarterman:
The design and Implementation of the 4.3 BSD UNIX Operating System.
Fig. 1.1 Addison Wesley 1989
.
We used splines in this example which looks nice if the graph is
printed to PostScript.
However for an interactive display, splines are not always useful
since spline drawing is not very fast.
Last change: 21.4.1995
Georg Sander
/ sander@cs.uni-sb.de
![[UNIX GRAPH SMALL]](../gif/unixa.gif)